|
>>
|
No. 4733
[Edit]
File
130730096353.png
- (16.71KB
, 600x463
, graph(1).png
)

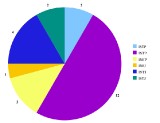
Hi /tc/. I'm astonishingly bored so I decided to compile some (shitty) pie charts for this thread. I hope I didn't miscount anything.
The results in text form:
MBTI:
12 INTP (50%)
4 INTJ (16,7%)
3 INFP (12,5%)
2 ISTP (8,3%)
2 ISTJ (8,3%)
1 INFJ (4,2%)
20 xNxx (83,3%)
4 xSxx (16,7%)
20 xxTx (83,3%)
4 xxFx (16,7%)
17 xxxP (70,8%)
7 xxxJ (29,2%)
Enneagram:
6 5w? (31,5%) - either wingless or no info was given
5 5w4 (26,3%)
4 5w6 (21,1%)
4 4w5 (21,1%)
15 Type 5 (78,9%)
4 Type 4 (21,1%)
Feel free to complain about how your type happened to be marked with a color you dislike.
|